By Jessica Saunders
Every year nearly half a million people are released from state and federal prisons and return to their communities. Too often, they end up back in prison.
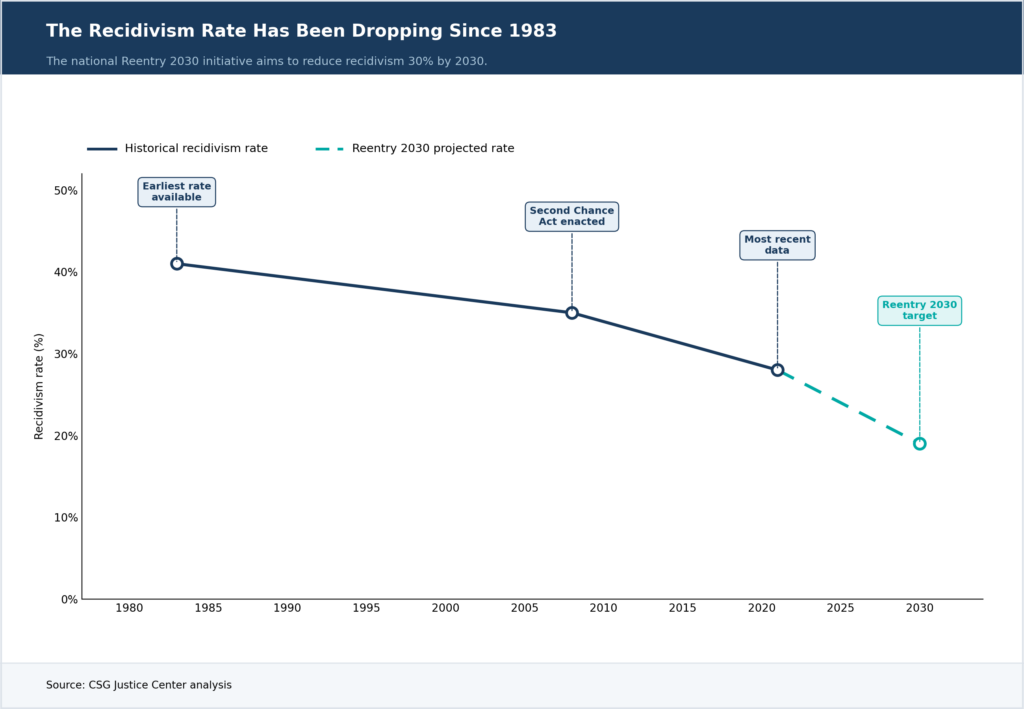
Reentry 2030 is a national initiative designed to change that by reducing the national recidivism rate 30% by 2030.
This post addresses a straightforward question: What does reducing recidivism mean, in concrete terms, for people and states?
National Recidivism Rates and Trends
A CSG Justice Center analysis of all 50 states found that the national 3-year reincarceration rate has fallen to 27%. That’s a 34% decline since 1983, the first year national-level estimates were available, and a 23% drop in the recidivism rate since the passage of the Second Chance Act in 2008.
Building on this progress, Reentry 2030 sets an ambitious goal: Reduce recidivism by an additional 30%.
Lower Prison Populations and Incarceration Costs
If Reentry 2030 achieves its central goal, roughly 500,000 more people will remain out of prison over the next decade, and states will avert more than $43 billion in incarceration costs.
Based on projected prison release figures for 2030, achieving a 30% reduction in recidivism from the current rate would mean that an additional 44,750 people released that year would not return to custody within 3 years of release. That’s 44,750 people who could remain in the community, working, supporting their families, and successfully rebuilding their lives.
The financial implications of a 30% reduction are equally significant. Preventing 44,750 people from returning to prison after their 2030 release would avert an estimated $3.9 billion in incarceration costs.
These savings would grow as progress continues.
A sustained 30% reduction in recidivism held through 2040 would result in over 500,000 additional people remaining out of prison for over a decade and could avert close to $44 billion in corrections costs. The scale of that shift—roughly half a million people over 10 years—represents an extraordinary change in the use of incarceration.
The trajectory shown in the table below is clear and consistent: As the population who are released and don’t return to prison grows, so does the scale of the opportunity. By 2040, each year of sustained progress would avert more than $4 billion in corrections costs and result in more than 46,000 additional people not returning to prison.
Projected Impact of a 30% Reduction in Recidivism, 2030–2040
| Year | Additional People Not Reincarcerated | Averted Costs to DOCs |
|---|---|---|
| 2030 | +44,750 | $3,924,561,407 |
| 2031 | +44,914 | $3,938,948,380 |
| 2032 | +45,071 | $3,952,664,340 |
| 2033 | +45,220 | $3,965,823,017 |
| 2034 | +45,364 | $3,978,401,667 |
| 2035 | +45,501 | $3,990,377,542 |
| 2036 | +45,630 | $4,001,750,643 |
| 2037 | +45,753 | $4,012,498,223 |
| 2038 | +45,868 | $4,022,620,283 |
| 2039 | +45,976 | $4,032,105,449 |
| 2040 | +46,077 | $4,040,965,095 |
| TOTAL | + 500,124 | $43,860,716,046 |
Caveats About Cost Savings
Critically, the $3.9 billion and $44 billion figures capture incarceration costs alone, which represents only a fraction of the true economic impact of reducing recidivism. It does not account for reduced costs for law enforcement, prosecutors, and courts; reduced victimization costs; or the broader fiscal impacts that flow from lower incarceration rates over time. The full social return on effective reentry investment is far larger than any single line item in a corrections budget.
Further, recidivism rates do not automatically translate into immediate budget savings. Most correctional costs—facility operations, staffing, and capital expenses—are fixed in the short term and take time to adjust. But sustained reductions create conditions for meaningful long-term savings: As populations decline, states can make deliberate decisions to close housing units, right-size staffing, and reduce reliance on contract beds.
The fiscal benefit grows over time, and the states that have achieved the deepest reductions are best positioned to realize it.
What Reducing Recidivism Means for States
The projections above represent an achievable opportunity—but one that requires deliberate action. These numbers describe what could happen if states commit to scaling evidence-based recidivism-reduction policies and programs that show what works, not what will happen automatically.
Reentry 2030 offers a framework for doing exactly that: setting clear national and state-by-state targets, aligning resources with proven strategies, and holding systems accountable for outcomes measured in recidivism rates. The projected fiscal impact makes the case that the investment is more than justified.
The cost of inaction, measured in preventable incarceration and its associated public expenditures, is simply too high.
Ready to Get Involved?
Through Reentry 2030, we partner with state leaders to design and implement data-driven, cross-systems plans. Together, we work to break the harmful and costly cycles between incarceration, homelessness, hospitalization, and unemployment—and set people up for a second chance after prison or jail.
For more on how your state can join, email reentry2030@csg.org.
Methodology & Technical Notes
Recidivism Data Collection
CSG Justice Center staff collected state-level recidivism data by reviewing each state department of corrections (DOC) website, including publicly available dashboards, annual reports, and special recidivism reports. Because no single standardized definition of recidivism exists across states, the primary measure we used was 3-year reincarceration following an annual prison release cohort—the most common approach, used by 33 states. When states did not report this measure, we substituted the closest available metric. We calculated a weighted desistance rate for each state using the most recent data available and applied it to each release year from 2017 through 2021.
Projecting 2030 Prison Releases
We calculated the average prison release rate per 100,000 people using data from 2018 through 2022, then applied it to U.S. Census Bureau population projections for 2030 through 2040. We sourced release data from BJS Prisoners Statistical Tables (2023) and population projections from the U.S. Census Bureau 2023 Summary Tables.
Estimating Recidivism Under a 30% Reduction Scenario
We estimated the number of people expected to return to custody under current conditions using each state’s most recent recidivism rate applied to projected release cohorts. The 30% reduction scenario applied a uniform 30% reduction to that rate. The difference between the two scenarios represents the number of additional people who would not return to custody.
Calculating Cost Avoidance
We used state-level incarceration cost data from 2021 to calculate a weighted average daily cost across all states, sourced from the CSG Justice Center’s Supervision Violations and Their Impact on Incarceration project. We obtained average lengths of stay for parole violation admissions from the National Corrections Reporting System 2021 admissions cohort; we substituted national averages where state-specific data were unavailable. Cost avoidance = [additional people not returning to custody] × [weighted average daily cost] × [average length of stay for parole violation admissions].
Limitations
This analysis provides a conservative estimate of recidivism-reduction benefits, capturing only incarceration costs while excluding avoided expenses for law enforcement, court, community supervision, and victimization. Projections assume stable population, crime, and sentencing trends through 2040. Cost-avoidance estimates rely on state averages and do not account for variation by offense type, individual characteristics, or supervision practices. Estimates are based on parole violation admissions and may not reflect costs of new criminal convictions. We substituted national averages where state-specific data were unavailable. Finally, these figures represent avoided incarceration costs rather than actual budget reductions and should not be interpreted as short-term savings for states.